
硅谷2104年1月份房屋销量大降
硅谷九个县2014年1月份销售量4696栋,比上个月的6714栋下降30.1%,比去年同月的5501栋下降14.6%。创2008年同月3586栋以来的最低点。
 Bay Area Home Sales Slowest for a January Since 2008
February 13, 2014
La Jolla, CA.—-Bay Area home sales remained at a six-year low in January, largely because too few properties are being put up for sale. Prices went through their normal mid-winter dip, but are still well ahead of year-ago levels, a real estate information service reported.
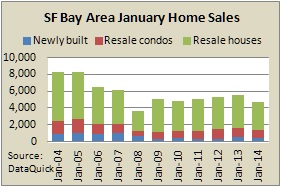
A total of 4,696 new and resale houses and condos sold in the nine-county Bay Area last month. That was the lowest sales tally for any January since 2008, when 3,586 homes sold. Last month’s sales fell 30.1 percent from 6,714 in December, and declined 14.6 percent from 5,501 in January 2013, according to San Diego-based DataQuick.
Home sales always decline from December to January, usually around 30 percent. Last month’s sales were 22.3 percent below the January average of 6,043 since 1988, when DataQuick’s statistics begin. Bay Area sales haven’t been above average for any month in more than seven years. The most active January was in 2005, when 8,298 homes sold, while the least active was in 2008, with 3,586 sales.
“Mid-winter numbers don’t really tell us much about upcoming activity. March is much more predictive. That said, what we’re seeing now is a continuation of what we’ve been seeing for the past half year. Not much is changing beyond the normal seasonal ebb and flow. This spring should be interesting. We may find out how much pent-up supply and demand is still on hold from the great recession, and how it will play itself out,” said John Walsh, DataQuick president.
The median price paid for a home in the Bay Area last month was $525,000. That’s down 4.3 percent from $548,500 in December, and up 26.5 percent from $415,000 in January 2013. For seasonal reasons the median almost always declines from December to January. The median has increased on a year-over-year basis for the last 22 months.
The Bay Area median peaked at $665,000 in June and July 2007, then dropped to a post-boom low of $290,000 in March 2009.
Last month the number of homes that sold for less than $500,000 dropped 22.7 percent year-over-year, while the number that sold for more increased 17.1 percent, DataQuick reported.
Distressed property sales – the combination of foreclosure resales and “short sales” – made up about 16 percent of the resale market last month. That’s up from about 15 percent in December and down from about 37 percent a year earlier.
Foreclosure resales – homes that had been foreclosed on in the prior 12 months – accounted for 5.4 percent of resales in January, up from a revised 4.6 percent the month before, and down from 14.1 percent a year ago. Foreclosure resales peaked at 52.0 percent in February 2009. The monthly average for foreclosure resales over the past 17 years is 9.9 percent.
Short sales – transactions where the sale price fell short of what was owed on the property – made up an estimated 10.5 percent of resales last month. That was the same as December’s estimate and down from 22.6 percent a year earlier.
Last month absentee buyers – mostly investors – purchased 24.2 percent of all Bay Area homes. That was up from December’s revised 22.5 percent and down from 28.3 percent for January a year ago. Absentee buyers paid a median $420,000 last month, up 40.0 percent from a year earlier.
Buyers who appear to have paid all cash – meaning no sign of a corresponding purchase loan was found in the public record – accounted for 24.8 percent of sales in January, up from a revised 23.5 percent in December and down from 28.4 percent a year earlier. The monthly average going back to 1988 is about 13 percent. Cash buyers paid a median $410,000 in January, up 36.4 percent from a year earlier.
Bay Area home buyers put $1.24 billion of their own money on the table last month in the form of a down payment or as an outright cash purchase. That number hit an all-time high of $2.64 billion last May.
Meantime, credit conditions appear to be improving gradually.
Adjustable-rate mortgages (ARMs), an important indicator of mortgage availability, accounted for 23.5 percent of the Bay Area’s home purchase loans in January. That was up from a revised 22.2 percent in December, and up from 10.9 percent in January last year. It was the highest since 25.4 percent in July 2008. ARMs hit a low of 3.0 percent of loans in January 2009. Since 2000, ARMs have accounted for 47.1 percent of all Bay Area purchase loans.
Jumbo loans, mortgages above the old conforming limit of $417,000, accounted for 46.9 percent of last month’s purchase lending, down a tad from a revised 48.2 percent in December, and up from 35.8 percent a year ago. Jumbo usage dropped as low as 17.1 percent in January 2009.
Bay Area home buyers borrowed a total of $1.76 billion in mortgage money from lenders last month. The most active lenders to those January buyers were Wells Fargo with 12.7 percent of the purchase loan market, Bank of America with 4.0 percent, and Stearns Lending with 3.7 percent.
Government-insured FHA home purchase loans, a popular choice among first-time buyers, accounted for 11.6 percent of all Bay Area purchase mortgages in January, up slightly from 10.9 percent in December and down from 15.0 percent a year earlier.
San Diego-based DataQuick monitors real estate activity nationwide and provides information to consumers, educational institutions, public agencies, lending institutions, title companies and industry analysts. Because of late data availability, sales were estimated in Alameda, San Francisco and San Mateo counties.
The typical monthly mortgage payment that Bay Area buyers committed themselves to paying last month was $2,111. Adjusted for inflation, last month’s payment was 25.9 percent below the typical payment in spring 1989, the peak of the prior real estate cycle. It was 45.3 percent below the current cycle’s peak in July 2007. It was 67.7 percent above the February 2012 bottom of the current cycle.
Indicators of market distress continue to decline. Foreclosure activity remains well below year-ago and far below peak levels. Financing with multiple mortgages is very low, and down payment sizes are stable, DataQuick reported.
| Sales Volume | Median Price | |||||
| All homes | Jan-13 | Jan-14 | % Chng | Jan-13 | Jan-14 | % Chng |
| Alameda | 1,196 | 958 | -19.9% | $385,000 | $489,500 | 27.1% |
| Contra Costa | 1,165 | 912 | -21.7% | $301,500 | $385,000 | 27.7% |
| Marin | 181 | 173 | -4.4% | $640,000 | $725,000 | 13.3% |
| Napa | 108 | 76 | -29.6% | $380,000 | $435,000 | 14.5% |
| Santa Clara | 1,115 | 1,034 | -7.3% | $550,000 | $625,000 | 13.6% |
| San Francisco | 394 | 354 | -10.2% | $699,000 | $884,500 | 26.5% |
| San Mateo | 421 | 410 | -2.6% | $600,500 | $735,000 | 22.4% |
| Solano | 523 | 424 | -18.9% | $219,000 | $282,750 | 29.1% |
| Sonoma | 398 | 355 | -10.8% | $340,000 | $412,500 | 21.3% |
| Bay Area | 5,501 | 4,696 | -14.6% | $415,000 | $525,000 | 26.5% |
Source: DataQuick, www.DQNews.com
Media calls: Andrew LePage (916) 456-7157
Copyright 2014 DataQuick. All rights reserved.