
加州硅谷2014年5月份房屋情况
《美国洋房网》自DataQuick的报道,加州硅谷今年5月房屋销售总量是 7,898栋,比上个月的7,555上升4.5%,比上一年同月的8,541栋下降7.5%。5月份的中间房价是$617000, 比上个月的610000上升1.1%, 比去年同月的 $519000上升18.9%。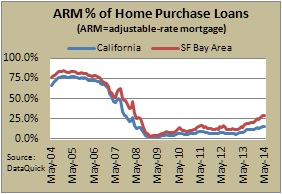
Bay Area Home Sales Constrained by Supply; Prices Continue to Rise
June 12, 2014
La Jolla, CA.—-Bay Area home sales remained below long-term norms in May as potential buyers continued to struggle with a limited inventory, prices near or beyond pre-recession highs, and a home loan environment that, while improved, remains fussy, a real estate information service reported.
A total of 7,898 new and resale houses and condos sold in the nine-county Bay Area last month. That was up 4.5 percent from 7,555 in April and down 7.5 percent from 8,541 in May last year, according to San Diego-based DataQuick.
Bay Area sales almost always increase from April to May. On average they have risen about 7.2 percent between those two months since 1988, when DataQuick’s statistics begin. May sales have ranged from a low of 6,216 in 2008 to a high of 13,567 in 2004. Last month’s sales were 17.4 percent below the May average of 9,558 sales since 1988. Bay Area sales haven’t been above average for any particular month in more than eight years.
“Virtually all the technical indicators are pointing in the direction of more market normalization. We are surprised that the rates of change in that direction remain so pitifully incremental. Right now we’re keeping an eye on prices. While some of the Bay Area counties have already re-reached or passed their pre-recession price peaks, the region as a whole is on pace to reach that point later this summer,” said John Karevoll, DataQuick analyst.
The median price paid for a home in the nine-county Bay Area rose last month to $617,000, the highest since it was $629,000 in November 2007. Last month’s median increased 1.1 percent from $610,000 in April, and rose 18.9 percent from $519,000 in May last year. On a year-over-year basis, the median has increased the last 26 months, with gains as high as 33.5 percent (last July).
The Bay Area’s median peaked at $665,000 in June and July 2007, then dropped to a low of $290,000 in March 2009.
The number of homes sold for less than $500,000 dropped 26.1 percent year-over-year, while the number that sold for more was up 3.3 percent.
A variety of market indicators are trending incrementally toward long-term norms.
Adjustable-rate mortgages (ARMs), an important indicator of mortgage availability, are slowly regaining their foothold in the market. ARMs accounted for 28.8 percent of the Bay Area’s home purchase loans in May, up from a revised 28.5 percent in April, and well up from the 14.1 percent in May last year. Last month’s ARM use was the highest since it was 30.9 percent of all loans in April 2008. ARMs hit a low of 3.0 percent of loans in January 2009. Since 2000, ARMs have accounted for 47.0 percent of all Bay Area purchase loans.
Jumbo loans, mortgages above the old conforming limit of $417,000, accounted for 56.6 percent of last month’s purchase lending, down slightly from a revised 56.9 percent in April, and up from 49.8 percent a year ago. Jumbo usage dropped to as low as 17.1 percent in January 2009.
Government-insured FHA home purchase loans, a popular choice among first-time buyers, accounted for 9.7 percent of all Bay Area home purchase mortgages in May, down from 9.8 percent in April and 9.9 percent a year earlier.
DataQuick was acquired in March by Irvine-based property information company CoreLogic. DataQuick provides information to consumers, educational institutions, public agencies, lending institutions, title companies and industry analysts. Because of late data availability, sales were estimated in Alameda, San Francisco and San Mateo counties.
Last month foreclosure resales – homes that had been foreclosed on in the prior 12 months – accounted for 3.1 percent of all resales, down from a revised 3.6 percent the month before, and down from 6.5 percent a year ago. Foreclosure resales peaked at 52.0 percent in February 2009. The monthly average for foreclosure resales over the past 17 years is 9.8 percent.
Short sales – transactions where the sale price fell short of what was owed on the property – made up an estimated 4.7 percent of Bay Area resales last month. That was up from an estimated 4.2 percent in April and down from 10.4 percent a year earlier.
Bay Area home buyers put $2.49 billion of their own money on the table last month in the form of a down payment or as an outright cash purchase. That number hit an all-time high of $2.64 billion in May a year ago. Home buyers borrowed $3.51 billion in mortgage money from lenders last month.
The most active lenders to Bay Area home buyers in May were Wells Fargo with 14.1 percent of the purchase loan market, Bank of America with 4.4 percent and RPM Mortgage with 3.7 percent, DataQuick reported.
Last month absentee buyers – mostly investors – purchased 20.5 percent of all Bay Area homes. That was up a hair from April’s revised 20.4 percent and down from 22.4 percent for May a year ago.
Buyers who appear to have paid all cash – meaning no sign of a corresponding purchase loan was found in the public record – accounted for 22.9 percent of sales in May, down from a revised 24.6 percent in April and down from 27.6 percent a year earlier.
The typical monthly mortgage payment that Bay Area buyers committed themselves to paying last month was $2,411. Adjusted for inflation, last month’s payment was 16.7 percent below the typical payment in spring 1989, the peak of the prior real estate cycle. It was 38.5 percent below the current cycle’s peak in July 2007. It was 88.5 percent above the February 2012 bottom of the current cycle.
Indicators of market distress continue to decline. Foreclosure activity remains well below year-ago and far below peak levels. Financing with multiple mortgages is very low, and down payment sizes are stable, DataQuick reported.
| Sales Volume | Median Price | |||||
| All homes | May-13 | May-14 | % Chng | May-13 | May-14 | % Chng |
| Alameda | 1,637 | 1,602 | -2.1% | $465,000 | $580,000 | 24.7% |
| Contra Costa | 1,653 | 1,563 | -5.4% | $410,000 | $464,000 | 13.2% |
| Marin | 414 | 385 | -7.0% | $795,000 | $825,000 | 3.8% |
| Napa | 166 | 129 | -22.3% | $419,250 | $550,000 | 31.2% |
| Santa Clara | 2,064 | 1,870 | -9.4% | $665,000 | $725,000 | 9.0% |
| San Francisco | 530 | 607 | 14.5% | $870,000 | $933,500 | 7.3% |
| San Mateo | 764 | 714 | -6.5% | $705,000 | $805,000 | 14.2% |
| Solano | 629 | 537 | -14.6% | $245,500 | $300,750 | 22.5% |
| Sonoma | 684 | 491 | -28.2% | $390,000 | $440,000 | 12.8% |
| Bay Area | 8,541 | 7,898 | -7.5% | $519,000 | $617,000 | 18.9% |
Source: DataQuick, www.DQNews.com