
南加州2014年11月房屋销售情况
 《美国洋房网》自DataQuick的报道,南加州今年11月房屋销售总量是15,643栋,比上个月的19,271下降 18.8%,比上一年同月的17,283栋下降9.5%。11月份中间房价是$412,000, 比上个月的410,000上升0.5%, 比去年同月的 $385,000上升7.0%。
Southern California November Home Sales Fall Sharply; Median Sale Price Holds Steady Again
December 15, 2014
CoreLogic® (NYSE: CLGX), a leading global property information, analytics and data-enabled services provider, today released its November Southern California housing market report. Home sales dropped to the lowest level for the month of November in seven years, the result of a relatively low number of days for recording deals, as well as fewer investor purchases and other market factors. There were also more signs of home prices flattening out: The region’s median sale price has changed little over the last three months and November marked the sixth consecutive month in which the median had a single-digit year-over-year gain, following 22 months of double-digit increases.
A total of 15,643 new and resale houses and condos sold in Los Angeles, Riverside, San Diego, Ventura, San Bernardino and Orange counties in November 2014. That was down 18.8 percent from 19,271 sales in October, and down 9.5 percent from 17,283 sales in November 2013, according to CoreLogic DataQuick data.
On average, Southern California sales have fallen 8.4 percent between October and November since 1988, when CoreLogic DataQuick data began. It’s likely that this November’s sales decline from October was especially sharp because of a calendar issue: There were only 17 days on which home sales could be recorded at county recorders’ offices this November, compared with 22 or 23 days in October, depending on the county. Over the last decade, there has been an average of about 19 days for such recordings in the month of November.
November home sales have ranged from a low of 13,173 in 2007 to a high of 31,987 in 1988. November 2014 sales were 26.7 percent below the November average of 21,340 sales. Between January and November of this year, home sales were down 9.8 percent from the same 11-month period in 2013.
“Southern California home sales are closing on a low note in 2014,” said Andrew LePage, data analyst for CoreLogic DataQuick. “Inventory still lags demand in many markets and traditional buyers haven’t filled the void left by the investors who’ve pulled out. Among would-be buyers, affordability and mortgage availability remain as hurdles, as do concerns about job security and the direction of the housing market. But there are reasons to expect more housing demand ahead. According to recent data from the federal government, job and income growth has improved. Many people who became renters after a foreclosure or short sale over the past seven years will want to buy again. And potential home buyers sitting on the fence might be tempted to jump off if they see evidence that mortgage rates will spike from today’s exceptionally low levels.”
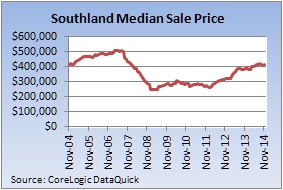
The median price paid for all new and resale houses and condos sold in the six-county region in November 2014 was $412,000, up 0.5 percent from $410,000 in October and up 7.0 percent from $385,000 in November 2013. The median hasn’t moved much since September this year, when it was $413,000. The median’s peak for 2014 was $420,000 in August.
Southern California’s $412,000 November median sale price was 18.4 percent below the peak $505,000 median reached in March, April, May and July of 2007. Among the region’s six counties, the November 2014 median in Orange County ($585,000) was the closest – within about 9 percent – to its peak of $645,000 in June 2007.
Home prices in Southern California have been rising at different rates depending on price segment. In November, the lowest-cost third of the region’s housing stock saw a 12.9 percent year-over-year increase in the median price paid per square foot for resale single-family detached houses. The annual gain was 6.3 percent for the middle third of the market and 2.3 percent for the top, most-expensive third.
The number of homes that sold for $500,000 or more this November fell 3.3 percent compared with November 2013. Sales below $500,000 fell 16.9 percent year-over-year, and sales below $200,000 dropped 35.4 percent.
Other Southern California housing market highlights from November 2014:
- Foreclosure resales represented 5.3 percent of the Southern California resale market in November. That was up from a revised 4.9 percent in October and down from 6.3 percent a year earlier. In recent months the foreclosure resale rate has been the lowest since early 2007. In the current cycle, foreclosure resales hit a high of 56.7 percent in February 2009. Foreclosure resales are purchased homes that had been previously foreclosed upon in the prior 12 months.
- Short sales made up an estimated 6.2 percent of resales in November, up from a revised 6.0 percent in October and down from 10.5 percent in November 2013. Short sales are transactions in which the sale price fell short of what was owed on the property.
- Absentee buyers – mostly investors – bought 23.5 percent of the homes sold in November. That was up slightly from a revised 23.2 percent in October and down from 26.8 percent in November 2013. The October 2014 level was the lowest for any month since October 2010, when 22.1 percent of homes were sold to absentee buyers. The peak absentee share was 32.4 percent in January 2013, while the monthly average since 2000, when the CoreLogic DataQuick absentee data begin, is about 19 percent. Absentee buyers include those who purchase vacation homes or other properties that public property records suggest are not used as primary residences.
- Cash buyers accounted for 23.9 percent of November home sales, up from 23.5 percent in October and down from 28.1 percent in November 2013. The October 2014 cash level was the lowest for any month since January 2009, when 22.0 percent of homes were bought with cash. The peak was 36.9 percent in February 2013, and since 1988 the monthly average is 16.7 percent.
- Southern California home buyers committed a total of $3.28 billion of their own money in the form of down payments or all-cash purchases in November. That was down from a revised $4.09 billion in October. The out-of-pocket total peaked in May 2013 at $5.41 billion.
- Jumbo loans, or mortgages above the old conforming limit of $417,000, accounted for 31.0 percent of purchase lending in November, down from a revised 31.7 percent in October and up from 27.9 percent in November 2013. The July/August 2014 level of 32.3 percent was the highest since the credit crunch struck in August 2007. Prior to August 2007 jumbo loans accounted for around 40 percent of the home-loan market. The jumbo level dropped to as low as 9.3 percent in January 2009.
- Adjustable-rate mortgages (ARMs) represented 12.3 percent of home purchase loans in November, down slightly from 12.9 percent in October and up from 11.2 percent in November 2013. The ARM share dropped to as low as 1.9 percent of home purchase loans in May 2009. Since 2000, a monthly average of about 30 percent of purchase loans have been ARMs.
- All lenders combined provided a total of $4.78 billion in mortgage money to Southern California home buyers in November, down from a revised $6.1 billion in October and down from $4.93 billion in November 2013.
- The typical monthly mortgage payment Southern California home buyers committed to was $1,560 in November, down from $1,574 in October and up from $1,517 in November 2013. Adjusted for inflation, the November 2014 typical payment was 35.9 percent below the typical payment in the spring of 1989, the peak of the prior real estate cycle. It was also 47.5 percent below the current cycle’s peak in July 2007.
Total November Home Sales
in Selected Southern California Counties
| Homes Sold | Median Sale Prices | |||||
| All homes | Nov-13 | Nov-14 | Percent Change | Nov-13 | Nov-14 | Percent Change |
| Los Angeles | 5,884 | 5,283 | -10.20% | $424,500 | $455,000 | 7.20% |
| Orange | 2,632 | 2,441 | -7.30% | $560,000 | $585,000 | 4.50% |
| Riverside | 2,934 | 2,642 | -10.00% | $275,000 | $305,000 | 10.90% |
| San Bernardino | 2,130 | 1,926 | -9.60% | $218,500 | $255,000 | 16.70% |
| San Diego | 3,018 | 2,675 | -11.40% | $415,000 | $430,000 | 3.60% |
| Ventura | 685 | 676 | -1.30% | $445,000 | $460,000 | 3.40% |
| SoCal | 17,283 | 15,643 | -9.50% | $385,000 | $412,000 | 7.00% |
Source: CoreLogic DataQuick. Data available at DQNews.com
Media calls: Andrew LePage (916) 456-7157
Copyright 2014 CoreLogic. All rights reserved.