
南加州房屋销数量六年来最低但房价仍上涨
 Southland December Home Sales at Six-Year Low; Median Price Jumps
January 14, 2014
La Jolla, CA—Southern California home sales fell to a six-year low for the month of December as investor activity eased again and buyers struggled with a tight inventory of homes for sale. The median price paid for a home jumped to the highest level in nearly six years, the result of demand outstripping supply, declining distress sales and a slight increase in the share of sales in mid- to high-end areas, a real estate information service reported.
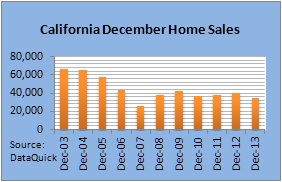
A total of 18,415 new and resale houses and condos sold in Los Angeles, Riverside, San Diego, Ventura, San Bernardino and Orange counties last month. That was up 6.5 percent from 17,283 sales in November, and down 9.2 percent from 20,274 sales in December 2012, according to San Diego-based DataQuick.
December’s sales gain from November is normal for the season, though it was weaker than usual. On average, sales have increased 12.4 percent between November and December since 1988, when DataQuick’s statistics begin.
Last month’s sales were 24.1 percent below the average number of sales – 24,254 – in the month of December. Southland sales haven’t been above average for any particular month in more than seven years. December sales have ranged from a low of 13,240 in December 2007 to high of 36,865 in December 2003.
“Sales have fallen short of the same period a year earlier for three consecutive months now, and the pitifully low inventory is the main culprit. The jump in home values over the last year suggests we’ll eventually see a lot more people interested in selling their homes, which would help ease the inventory crunch. More supply would put downward pressure on prices, as would rising mortgage rates. But there are reasons to believe we’ll continue to see upward pressure on prices, too. Home building has risen but remains at relatively low levels, meaning no major boost to the overall supply of homes for sale. Meanwhile, demand is being fueled by a gradually improving economy. Also, some of the people who lost homes during the foreclosure crisis will be looking to own again,” said John Walsh, DataQuick president.
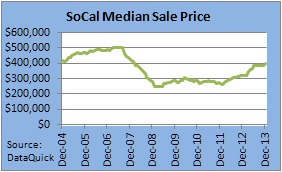
The median price paid for all new and resale houses and condos sold in the six-county region last month rose to $395,000 – the peak for 2013 and the highest for any month since the median was $408,000 in February 2008. Last month’s median was up 2.6 percent from $385,000 in November and up 22.3 percent from $323,000 in December 2012. Until last month the median had more or less moved sideways – ranging from $382,000 to $385,000 – since last June.
The median sale price has risen on a year-over-year basis for 21 consecutive months. Those gains have been double-digit – between 10.8 percent and 28.3 percent – over the past 17 months.
The December median stood 21.8 percent below the peak $505,000 median in spring/summer 2007.
It appears most of last month’s 22.3 percent year-over-year increase in the Southland median sale price reflects rising home prices, while a small portion reflects a change in market mix. This mix change consists of a significant increase in mid- to high-end sales over the last year and a big decline in sales of lower-cost distressed properties.
In December, the lowest-cost third of the region’s housing stock saw a 21.9 percent year-over-year rise in the median price paid per square foot for resale houses. The annual gain was 19.7 percent for the middle third of the market and 12.7 percent for the top, most-expensive third.
Home sales in many middle and up-market areas continued to post year-over-year gains, while more affordable markets generally saw activity drop.
Last month the number of homes sold from $300,000 through $799,999 – a range that includes many move-up buyers – rose 1.7 percent year-over-year. The number that sold for $500,000 or more increased 11.9 percent from one year earlier, while $800,000-plus sales rose 5.8 percent.
In December, 34.5 percent of all Southland home sales were for $500,000 or more, up from a revised 32.7 percent the month before and 26.0 percent a year earlier.
The number of Southland homes sold below $200,000 last month dropped 45.6 percent year-over-year, while sales below $300,000 fell 38.0 percent. Low-end deals have fallen largely because of an inadequate supply of homes for sale. Many owners still can’t afford to sell their homes because they owe more than they are worth, and lenders aren’t foreclosing on as many properties, further limiting supply.
Foreclosure resales – homes foreclosed on in the prior 12 months – accounted for 5.8 percent of the Southland resale market in December. That was down from 6.3 percent the prior month and was down from 14.2 percent a year earlier. Last month’s foreclosure resale rate was the lowest since it was 5.4 percent in May 2007. In the current cycle, foreclosure resales hit a high of 56.7 percent in February 2009.
Short sales – transactions where the sale price fell short of what was owed on the property – made up an estimated 13.2 percent of Southland resales last month. That was up slightly from 12.8 percent the prior month and down from 26.7 percent a year earlier.
Absentee buyers – mostly investors and some second-home purchasers – bought 26.2 percent of the Southland homes sold last month. That’s the lowest share for any month since it was 25.1 percent in November 2011. Last month’s absentee level was down from 26.6 percent the month before and down from 30.4 percent a year earlier. The absentee share has trended lower almost every month since hitting a record 32.4 percent in January 2013. The monthly average since 2000, when the absentee data begin, is 18.5 percent.
Last month’s absentee buyers paid a median $323,250, up 1.0 percent from the month before and up 24.3 percent year-over-year.
In December 5.8 percent of all Southland homes sold on the open market were flipped, meaning they had previously sold in the prior six months. That’s up from a flipping rate of 5.7 percent the month before and up from 5.5 percent a year earlier. Flipping peaked at 7.0 percent last February. (The figures exclude homes resold after being purchased at public foreclosure auction sales on the courthouse steps).
Buyers paying cash in December accounted for 27.7 percent of home sales, down from 28.0 percent the month before and down from 35.8 percent a year earlier. The cash share of purchases has trended sideways or lower each month since hitting an all-time peak of 36.9 percent last February. In December the cash share was at its lowest level since it was 26.2 percent in September 2010. Since 1988 the monthly average for cash buyers is 16.4 percent of all sales. Cash buyers paid a median $351,500 last month, up 1.0 percent month-to-month and up 29.9 percent from a year earlier.
In December Southern California home buyers forked over a total of $3.99 billion of their own money in the form of down payments or cash purchases. That was up from a $3.78 billion in November and down from $4.51 billion a year ago. The out-of-pocket total peaked last May at $5.41 billion.
Credit conditions don’t seem to have changed much month-to-month but the difference from a year earlier is significant.
In December, 12.9 percent of Southland home purchase loans were adjustable-rate mortgages (ARMs) – double the ARM rate of a year earlier. Last month’s figure was up from 11.3 percent the month before and up from 6.2 percent a year earlier. Since 2000, a monthly average of about 31 percent of Southland purchase loans have been ARMs.
Jumbo loans, mortgages above the old conforming limit of $417,000, accounted for 28.4 percent of last month’s Southland purchase lending. That was up from 27.9 percent the prior month and up from 22.8 percent a year earlier. In the months leading up to the credit crunch that struck in August 2007, jumbos accounted for around 40 percent of the home loan market.
All lenders combined provided a total of $5.29 billion in mortgage money to Southern California home buyers in December, up from $4.93 billion in November and up from $3.62 billion in December last year.
The most active lenders to Southern California home buyers last month were Wells Fargo with 7.7 percent of the total home purchase loan market, Bank of America with 2.7 percent and IMortgage with 2.2 percent.
Government-insured FHA loans, a popular low-down-payment choice among first-time buyers, accounted for 19.6 percent of all purchase mortgages last month. That was down from 20.3 percent the month before and down from 23.1 percent a year earlier. In recent months the FHA share has been the lowest since early 2008, mainly because of tighter FHA qualifying standards and the difficulties first-time buyers have competing with investors and cash buyers.
DataQuick monitors real estate activity nationwide and provides information to consumers, educational institutions, public agencies, lending institutions, title companies and industry analysts.
The typical monthly mortgage payment Southland buyers committed themselves to paying last month was $1,594, up from $1,517 the month before and up from $1,139 a year earlier. Adjusted for inflation, last month’s typical payment was 33.3 percent below the typical payment in the spring of 1989, the peak of the prior real estate cycle. It was 45.4 percent below the current cycle’s peak in July 2007.
Indicators of market distress continue to decline. Foreclosure activity remains well below year-ago and far below peak levels. Financing with multiple mortgages is very low, and down payment sizes are stable, DataQuick reported.
| Sales Volume | Median Price | |||||
| All homes | Dec-12 | Dec-13 | %Chng | Dec-12 | Dec-13 | %Chng |
| Los Angeles | 7,198 | 6,240 | -13.30% | $352,000 | $430,000 | 22.20% |
| Orange | 3,070 | 3,089 | 0.60% | $470,000 | $570,000 | 21.30% |
| Riverside | 3,248 | 3,068 | -5.50% | $231,000 | $280,000 | 21.20% |
| San Bernardino | 2,135 | 2,154 | 0.90% | $180,000 | $232,000 | 28.90% |
| San Diego | 3,757 | 3,099 | -17.50% | $366,000 | $420,000 | 14.80% |
| Ventura | 866 | 765 | -11.70% | $370,000 | $449,500 | 21.50% |
| SoCal | 20,274 | 18,415 | -9.20% | $323,000 | $395,000 | 22.30% |
Source: DQNews.com Media calls: Andrew LePage (916) 456-7157
Copyright 2014 DataQuick. All rights reserved.