
南加州2014年6月房地产市场报告
 《美国洋房网》自DataQuick的报道,南加州今年6月房屋销售总量是20,654栋,比上个月的19,556上升 25.6%,比上一年同月的21,608栋下降4.4%。6月份的中间房价是$415000, 比上个月的400,000上升1.2%, 比去年同月的 $385000上升17.8%。
2014年6
Southland Home Sales Down from Last Year Again; Price Gains Throttle Back
July 15, 2014
La Jolla, CA—Southern California homes sold at the slowest pace for a June in three years as investor purchases fell again and other would-be buyers continued to struggle with inventory and affordability constraints. The median price paid for a home rose to its highest level in 77 months but the single-digit gain from a year earlier was the smallest in two years, a real estate information service reported.
A total of 20,654 new and resale houses and condos sold in Los Angeles, Riverside, San Diego, Ventura, San Bernardino and Orange counties last month. That was up 5.6 percent from 19,556 sales in May, and down 4.4 percent from 21,608 sales in June last year, according to DataQuick, which is owned by Irvine-based CoreLogic, a leading global property information, analytics and data-enabled services provider.
On average, sales have increased 6.4 percent between May and June since 1988, when DataQuick’s statistics begin. Sales have fallen on a year-over-year basis for nine consecutive months. Sales during the month of June have ranged from a low of 18,032 in June 2008 to a high of 40,156 in June 2005. Last month was 23.7 percent below the June average of 27,069 sales. Sales haven’t been above the long-term average for more than eight years.
“Pent-up demand, job growth and still-low mortgage rates continue to put pressure on home prices. But they’re climbing at a much slower pace than a year ago. In many markets price appreciation has slipped into the more sustainable single-digit range, compared with gains exceeding 20 percent this time last year. Why the drop-off? The supply of homes for sale, while still low in an historical context, is higher this year, and the decline in affordability serves as gravity for home prices. People can’t stretch with exotic and risky loans the way they could during the last housing boom,” said Andrew LePage, a DataQuick analyst.
“Many of the market indicators we track continue to ease toward normalcy,” he added. “For example, the use of larger, so-called jumbo loans is up significantly this year, as is the use of adjustable-rate mortgages. Distressed property sales are way down and, related to that, investor and cash purchases are trending lower, toward more normal levels.”
The median price paid for all new and resale houses and condos sold in the six-county region last month was $415,000, up 1.2 percent from $410,000 in May and up 7.8 percent from $385,000 in June 2013. While last month’s median was the highest since it was also $415,000 in January 2008, the 7.8 percent year-over-year gain was the lowest since June 2012, when the $300,000 median rose 5.3 percent.
The Southland median has risen on a year-over-year basis for 27 straight months. But June marked the end of the median’s 22-month streak of double-digit year-over-year gains, which peaked at 28.3 percent in June last year.
Last month three counties – San Diego, Los Angeles and Ventura – logged single-digit, year-over-year gains in their median sale prices.
The Southland’s June median stood 17.8 percent below the peak $505,000 median in spring/summer 2007.
San Diego-based DataQuick monitors real estate activity nationwide and provides information to consumers, educational institutions, public agencies, lending institutions, title companies and industry analysts. CoreLogic acquired DataQuick in March.
Last month home prices continued to rise at different rates depending on price segment. In June, the lowest-cost third of the region’s housing stock saw a 17.1 percent year-over-year increase in the median price paid per square foot for resale houses. The annual gain was 10.8 percent for the middle third of the market and 5.2 percent for the top, most-expensive third.
The number of homes that sold for $500,000 or more last month rose 1.9 percent from one year earlier, while sales below $500,000 fell 12.8 percent year-over-year. Sales below $200,000 tumbled 36.0 percent.
In June, 37.3 percent of all Southland home sales were for $500,000 or more, down a tad from a revised 37.9 percent in May, which was the highest level since $500,000-plus deals made up 38.3 percent of sales in December 2007. In June last year 33.7 percent of sales crossed the $500,000 threshold.
The market impact of distressed properties continued to fade in June.
Foreclosure resales – homes foreclosed on in the prior 12 months – accounted for 5.3 percent of the Southland resale market last month. That was up slightly from a revised 5.0 percent the prior month and down from 9.0 percent a year earlier. In recent months the foreclosure resale rate has been the lowest since early 2007. In the current cycle, foreclosure resales hit a high of 56.7 percent in February 2009.
Short sales – transactions where the sale price fell short of what was owed on the property – made up an estimated 6.0 percent of Southland resales last month. That was down from a revised 6.4 percent the prior month and down from 14.5 percent a year earlier.
Absentee buyers – mostly investors and some second-home purchasers – bought 23.6 percent of the Southland homes sold last month. That was the lowest share since December 2010, when 23.4 percent of homes sold to absentee buyers. Last month’s 23.6 percent absentee share was down from 24.9 percent in May and down from 29.0 percent a year earlier. The peak was 32.4 percent in January 2013, while the monthly average since 2000, when the absentee data begin, is about 19 percent.
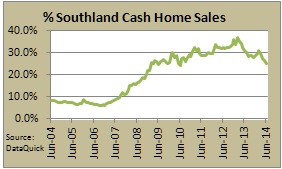
Cash purchases dropped to the lowest level in four years last month. Buyers paying cash accounted for 25.1 percent of June home sales, down from 26.4 percent the month before and down from 31.2 percent in June last year. The last time cash purchases were lower than last month was in June 2010, when 24.2 percent of Southland homes were bought with cash. The peak was 36.9 percent in February 2013, and since 1988 the monthly average is 16.6 percent.
In June, Southern California home buyers forked over a total of $4.58 billion of their own money in the form of down payments or cash purchases. That was down from a revised $4.82 billion in May. The out-of-pocket total peaked in May 2013 at $5.41 billion.
Credit conditions have generally improved this year, with significant changes compared with this time last year.
Jumbo loans, mortgages above the old conforming limit of $417,000, accounted for 32.2 percent of last month’s Southland purchase lending – the highest jumbo level for any month since the credit crunch struck in August 2007. Last month’s figure was up from 32.0 percent in May and up from 28.6 percent a year earlier. Prior to August 2007 jumbos accounted for around 40 percent of the home loan market. The jumbo level dropped to as low as 9.3 percent in January 2009.
In June, 13.9 percent of Southland home purchase loans were adjustable-rate mortgages (ARMs), down from 14.9 percent in May and up from 9.3 percent a year ago. ARM use dropped to as low as 1.9 percent of all purchase loans in May 2009. Since 2000, a monthly average of about 31 percent of Southland purchase loans have been ARMs.
All lenders combined provided a total of $6.6 billion in mortgage money to Southern California home buyers in June, up from a revised $6.26 billion in May and up from $6.08 billion in June last year. Last month’s figure was the highest since August 2007, when it was $7.92 billion.
The most active lenders to Southern California home buyers last month were Wells Fargo with 7.0 percent of the total home purchase loan market, Bank of America with 3.1 percent and New American Funding Lending with 2.3 percent.
Government-insured FHA loans, a popular low-down-payment choice among first-time buyers, accounted for 18.9 percent of all purchase mortgages last month. That was down from 19.0 percent the month before and down from 19.4 percent a year earlier. In recent months the FHA share has been the lowest since early 2008, mainly because of tighter FHA qualifying standards and the difficulties first-time buyers have competing with investors and cash buyers.
The typical monthly mortgage payment Southland buyers committed themselves to paying last month was $1,616, up from $1,602 the month before and up from $1,483 a year earlier. Adjusted for inflation, last month’s typical payment was 34.1 percent below the typical payment in the spring of 1989, the peak of the prior real estate cycle. It was 46.0 percent below the current cycle’s peak in July 2007.
Indicators of market distress continue to decline. Foreclosure activity remains well below year-ago and far below peak levels. Financing with multiple mortgages is very low, and down payment sizes are stable, DataQuick reported.
| Sales Volume | Median Price | |||||
| All homes | Jun-13 | Jun-14 | %Chng | Jun-13 | Jun-14 | %Chng |
| Los Angeles | 7,342 | 6,792 | -7.50% | $425,000 | $450,000 | 5.90% |
| Orange | 3,350 | 3,309 | -1.20% | $545,000 | $600,000 | 10.10% |
| Riverside | 3,536 | 3,451 | -2.40% | $269,250 | $300,000 | 11.40% |
| San Bernardino | 2,436 | 2,431 | -0.20% | $204,000 | $240,000 | 17.60% |
| San Diego | 4,048 | 3,736 | -7.70% | $416,500 | $450,000 | 8.00% |
| Ventura | 896 | 935 | 4.40% | $450,000 | $470,000 | 4.40% |
| SoCal | 21,608 | 20,654 | -4.40% | $385,000 | $415,000 | 7.80% |
| Sales Volume | Median Price | |||||
| All homes | Jun-13 | Jun-14 | %Chng | Jun-13 | Jun-14 | %Chng |
| Los Angeles | 7,342 | 6,792 | -7.50% | $425,000 | $450,000 | 5.90% |
| Orange | 3,350 | 3,309 | -1.2% | $545,000 | $600,000 | 10.10% |
| Riverside | 3,536 | 3,451 | -2.40% | $269,250 | $300,000 | 11.40% |
| San Bernardino | 2,436 | 2,431 | -7.70% | $204,000 | $240,000 | 17.60% |
| San Diego | 4,048 | 3,736 | -7.70% | $416,500 | $450,000 | 8.00% |
| Ventura | 896 | 935 | 4.40% | $450,000 | $470,000 | 4.40% |
| SoCal | 21,608 | 20,654 | -4.40% | $385,000 | $415,000 | 7.80% |