
加州银行拍卖屋达八年最低
加州银行拍卖屋上季度(2013年十月至2013年十二月)总量为18120栋。这比前一季度的20314栋下降10.8%,比上一年同季度下降52.6%。详情请阅读DataQuick的详细报道。
California Foreclosure Starts Dip to Eight-Year Low
January 21, 2014
La Jolla, CA.–The number of California homeowners pulled into the formal foreclosure process dropped to an eight-year low last quarter, the result of an improving economy, foreclosure prevention efforts and higher home prices, a real estate information service reported.
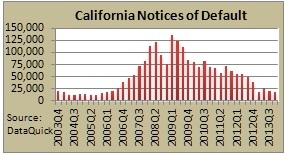
A total of 18,120 Notices of Default (NoDs) were recorded by lenders and their servicers on California owners of houses and condos during the October-through-December period. That was down 10.8 percent from 20,314 for the prior quarter, and down 52.6 percent from 38,212 in fourth-quarter 2012. Last quarter’s tally was the lowest since 15,337 NoDs were recorded during fourth-quarter 2005. NoDs peaked in first-quarter 2009 at 135,431. DataQuick’s NoD statistics go back to 1992.
“Some of this decline in foreclosure starts stems from the use of various foreclosure prevention efforts – short sales, loan modifications and the ability of some underwater homeowners to refinance. But most of the drop is because of the improving economy and the increase in home values. Fewer people are behind on their mortgage payments. And of those who do get into trouble, many, if not most, can sell and pay off what they owe. Also, those who are underwater and close to slipping into foreclosure are far less likely to give up their homes now that appreciation has returned to the housing market. There’s a strong incentive to hang on,” said John Walsh, DataQuick president.
The median price paid for a California home was $364,000 in the fourth quarter, up 22.1 percent from $298,000 a year earlier. The median has risen more than 20 percent on a year-over-year basis for the last five quarters. It peaked in second-quarter 2007 at $485,500 and hit bottom at $235,000 in second-quarter 2009, DataQuick reported.
Continuing a years-long trend, mortgage defaults remained far more concentrated in the state’s most affordable neighborhoods. Zip codes with 2013 median sale prices below $200,000 collectively saw 3.1 NoDs filed last quarter for every 1,000 homes in those zip codes. The ratio was 2.0 NoDs per 1,000 homes for zip codes with $200,000-to-$800,000 medians, while there were 0.7 NoDs filed per 1,000 homes for the group of zips with medians above $800,000.
Most of the loans going into default are still from the 2005-2007 period. The median origination quarter for defaulted loans is still third-quarter 2006. That has been the case for more than four years, indicating that weak underwriting standards peaked then.
On primary mortgages, California homeowners were a median 8.7 months behind on their payments when the lender filed the Notice of Default. The borrowers owed a median $20,066 on a median $302,000 mortgage.
On home equity loans and lines of credit in default, borrowers owed a median $5,491 on a median $68,770 credit line. The amount of the credit line that was actually in use cannot be determined from public records.
The most active “beneficiaries” in the formal foreclosure process last quarter were Wells Fargo (3,287), JP Morgan Chase (1,182) and Nationstar (1,096).
The trustees who pursued the highest number of defaults last quarter were Quality Loan Service Corp (for Wells Fargo and others), Trustee Corps (OneWest Bank and Green Tree) and Northwest Trustee Services (JP Morgan Chase).
San Diego-based DataQuick monitors real estate activity nationwide and provides information to consumers, educational institutions, public agencies, lending institutions, title companies and industry analysts. Notices of Default are recorded at county recorders offices and mark the first step of the formal foreclosure process.
Although 18,120 default notices were filed last quarter, they involved 17,773 homes because some borrowers were in default on multiple loans (e.g. a primary mortgage and a line of credit).
Among the state’s larger counties, loans were least likely to go into default last quarter in Marin, Santa Clara and San Mateo counties. The probability was highest in Tulare, Fresno and Riverside counties.
Trustees Deeds recorded (TDs), or the finalized loss of a home to the formal foreclosure process, totaled 8,205 last quarter – the second-lowest level in seven years, behind third-quarter 2013. Last quarter’s foreclosure total was up 2.2 percent from 8,030 during third-quarter 2013 and down 61.2 percent from 21,127 during fourth-quarter 2012. The all-time peak was 79,511 foreclosures in third-quarter 2008. The state’s all-time low was 637 in second-quarter 2005, DataQuick reported.
Foreclosures remained most concentrated in the more affordable communities. Zip codes with 2013 median sale prices below $200,000 collectively saw 2.0 homes foreclosed on in fourth-quarter 2013 for every 1,000 homes in existence. That compares with 0.8 foreclosures per 1,000 homes for zips with $200,000-to-$800,000 medians, and 0.2 foreclosures per 1,000 homes for the group of zips with $800,000-plus medians.
On average, homes foreclosed on last quarter took 9.0 months to wind their way through the formal foreclosure process, beginning with an NoD. That’s down a hair from an average of 9.1 months the prior quarter and up slightly from 8.9 months a year earlier.
At formal foreclosure auctions held statewide last quarter, an estimated 40.0 percent of the foreclosed properties were bought by investors or others that don’t appear to be lender or government entities. That was down from an estimated 48.0 percent the previous quarter and down from 41.8 percent a year earlier, DataQuick reported.
Foreclosure resales – properties foreclosed on in the prior 12 months – accounted for 6.7 percent of all California resale activity last quarter. That was down from 7.7 percent the prior quarter and down from 16.6 percent a year earlier. Foreclosure resales peaked at 57.8 percent in first-quarter 2009. Among the state’s larger counties last quarter, foreclosure resales varied from 2.0 percent in Marin County to 14.1 percent in Tulare County.
Short sales – transactions where the sale price fell short of what was owed on the property – made up an estimated 12.5 percent of the state’s resale market last quarter. That was down from an estimated 13.5 percent the prior quarter and 25.8 percent a year earlier. Last quarter’s short sale level was the lowest since it was 11.7 percent in first-quarter 2009.
Notices of Default (Trustees Deeds further down) houses and condos
| County/Region | 2012Q4 | 2013Q4 | Yr/Yr% |
| Los Angeles | 8,100 | 4,192 | -48.2% |
| Orange | 2,169 | 1,108 | -48.9% |
| San Diego | 2,655 | 1,302 | -51.0% |
| Riverside | 3,887 | 1,831 | -52.9% |
| San Bernardino | 3,165 | 1,587 | -49.9% |
| Ventura | 728 | 343 | -52.9% |
| Imperial | 175 | 72 | -58.9% |
| Socal | 20,879 | 10,435 | -50.0% |
| San Francisco | 236 | 116 | -50.8% |
| Alameda | 1,194 | 515 | -56.9% |
| Contra Costa | 1,342 | 549 | -59.1% |
| Santa Clara | 867 | 405 | -53.3% |
| San Mateo | 346 | 172 | -50.3% |
| Marin | 149 | 65 | -56.4% |
| Solano | 696 | 316 | -54.6% |
| Sonoma | 452 | 181 | -60.0% |
| Napa | 117 | 39 | -66.7% |
| Bay Area | 5,399 | 2,358 | -56.3% |
| Santa Cruz | 168 | 84 | -50.0% |
| Santa Barbara | 316 | 136 | -57.0% |
| San Luis Obispo | 221 | 91 | -58.8% |
| Monterey | 377 | 103 | -72.7% |
| Coast | 1,082 | 414 | -61.7% |
| Sacramento | 2,195 | 1,002 | -54.4% |
| San Joaquin | 1,098 | 441 | -59.8% |
| Placer | 469 | 222 | -52.7% |
| Kern | 1,082 | 584 | -46.0% |
| Fresno | 1,150 | 576 | -49.9% |
| Madera | 209 | 85 | -59.3% |
| Merced | 332 | 126 | -62.0% |
| Tulare | 515 | 281 | -45.4% |
| Yolo | 173 | 67 | -61.3% |
| El Dorado | 262 | 77 | -70.6% |
| Stanislaus | 798 | 355 | -55.5% |
| Kings | 172 | 87 | -49.4% |
| San Benito | 65 | 30 | -53.8% |
| Yuba | 114 | 62 | -45.6% |
| Colusa | 18 | 10 | -44.4% |
| Sutter | 121 | 54 | -55.4% |
| Central Valley | 8,773 | 4,059 | -53.7% |
| Mountains | 551 | 270 | -51.0% |
| North Calif | 1,528 | 584 | -61.8% |
| Statewide* | 38,212 | 18,120 | -52.6% |
includes additional counties
Trustees Deeds Recorded (number of homes foreclosed on) houses and condos
| County/Region | 2012Q4 | 2013Q4 | Yr/Yr% |
| Los Angeles | 3,496 | 1,307 | -62.6% |
| Orange | 941 | 317 | -66.3% |
| San Diego | 1,285 | 471 | -63.3% |
| Riverside | 2,400 | 849 | -64.6% |
| San Bernardino | 2,025 | 910 | -55.1% |
| Ventura | 330 | 111 | -66.4% |
| Imperial | 127 | 40 | -68.5% |
| Socal | 10,604 | 4,005 | -62.2% |
| San Francisco | 79 | 37 | -53.2% |
| Alameda | 541 | 198 | -63.4% |
| Contra Costa | 779 | 303 | -61.1% |
| Santa Clara | 330 | 115 | -65.2% |
| San Mateo | 149 | 54 | -63.8% |
| Marin | 56 | 31 | -44.6% |
| Solano | 500 | 178 | -64.4% |
| Sonoma | 269 | 85 | -68.4% |
| Napa | 62 | 22 | -64.5% |
| Bay Area | 2,765 | 1,023 | -63.0% |
| Santa Cruz | 87 | 30 | -65.5% |
| Santa Barbara | 177 | 74 | -58.2% |
| San Luis Obispo | 123 | 51 | -58.5% |
| Monterey | 180 | 47 | -73.9% |
| Coast | 567 | 202 | -64.4% |
| Sacramento | 1,639 | 554 | -66.2% |
| San Joaquin | 703 | 305 | -56.6% |
| Placer | 281 | 96 | -65.8% |
| Kern | 744 | 309 | -58.5% |
| Fresno | 770 | 319 | -58.6% |
| Madera | 145 | 64 | -55.9% |
| Merced | 255 | 76 | -70.2% |
| Tulare | 350 | 177 | -49.4% |
| Yolo | 123 | 37 | -69.9% |
| El Dorado | 146 | 61 | -58.2% |
| Stanislaus | 512 | 181 | -64.6% |
| Kings | 108 | 62 | -42.6% |
| San Benito | 30 | 8 | -73.3% |
| Yuba | 68 | 40 | -41.2% |
| Colusa | 18 | 12 | -33.3% |
| Sutter | 104 | 38 | -63.5% |
| Central Valley | 5,996 | 2,339 | -61.0% |
| Mountains | 351 | 183 | -47.9% |
| North Calif | 844 | 453 | -46.3% |
| Statewide* | 21,127 | 8,205 | -61.2% |
* includes additional counties
Source: DataQuick; DQNews.com
Media calls: Andrew LePage (916) 456-7157
Copyright 2014 DataQuick. All rights reserved.