
加州第一季度银行拍卖屋居八年来最低
《美国洋房网》最新报道,加州第一季度银行拍卖屋居八年来最低。详细数字请读DqNews 的报道。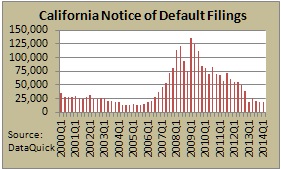
California Foreclosure Starts Hover Near 8-Year Low
April 22, 2014
La Jolla, CA.–For the third consecutive quarter California foreclosure starts remained little changed at a level last seen in early 2006, the result of steady economic growth and higher home values. Foreclosure processors are still mostly plowing through a pool of toxic subprime mortgages originated back in mid-to-late 2006, a real estate information service reported.
Lenders and their servicers recorded 19,215 Notices of Default (NoDs) on California house and condo owners during this year’s first quarter, which runs January through March. That was up 6.0 percent from 18,120 NoDs in the prior quarter, which had the lowest NoD tally since fourth-quarter 2005, and was up 3.5 percent from 18,568 NoDs in first-quarter last year, according to San Diego-based DataQuick.
The trough for DataQuick’s NoD statistics, which begin in 1992, was 12,417 in third-quarter 2004, while the peak was 135,431 in first-quarter 2009. Each NoD represents a “foreclosure start” because the filing of the Notice of Default begins the formal foreclosure process.
“It may well be that the foreclosure starts in recent quarters don’t reflect the ebb and flow of financial distress as much as they reflect a steady state of workload capacity on the part of the servicers. They may well be just working their way through a backlog, stacks of paper piled high on desks,” said John Karevoll, DataQuick analyst.
The past three quarters, along with the first quarter of 2013, have seen the lowest NoD totals since late 2005 and early 2006.
Although this year’s first quarter was the first to log a year-over-year increase in default filings since fourth quarter 2009, that gain can be attributed to an anomaly early in first-quarter 2013: There was a short-lived plunge in NoD filings in January and February last year as new state laws – known as the “Homeowner Bill of Rights” – took effect, causing lenders and services to pause and adjust. On a year-over-year basis, NoD filings have only increased in January this year, rising 63.9 percent, while February and March NoD levels fell 2.8 percent and 22.5 percent, respectively, from a year earlier. Still, the January gain was enough to put all of first-quarter 2014 ahead of first-quarter last year.
Absent an economic shock, the number of homeowners defaulting on their mortgage should continue to trend lower thanks to the economic rebound and higher home prices. For a variety of reasons, however, NoD filings could edge higher month-to-month and quarter-to-quarter. For example, some larger lenders and servicers could quicken the pace at which they’re processing existing backlogs of distressed properties. And there could be a spike in “re-defaults” among borrowers who avoided foreclosure with a loan modification.
Most of the loans going into default are still from the 2005-2007 period. The median origination quarter for defaulted loans is still third-quarter 2006. That has been the case for more than four years, indicating that weak underwriting standards peaked then.
On primary mortgages, California homeowners were a median 9.8 months behind on their payments when the lender filed the Notice of Default. The borrowers owed a median $22,538 on a median $301,732 mortgage.
On home equity loans and lines of credit in default, borrowers owed a median $5,924 on a median $69,603 credit line. The amount of the credit line that was actually in use cannot be determined from public records.
The most active “beneficiaries” in the formal foreclosure process last quarter were Wells Fargo (2,834), Bank of America (1,637) and Nationstar (1,282).
The trustees who pursued the highest number of defaults last quarter were Quality Loan Service Corp (for Wells Fargo and others), MTC Financial (Bank of America, Greentree, JP Morgan Chase) and Western Progressive (OCWEN and Deutsche Bank).
San Diego-based DataQuick monitors real estate activity nationwide and provides information to consumers, educational institutions, public agencies, lending institutions, title companies and industry analysts. DataQuick was acquired last month by Irvine-based property information company CoreLogic.
Although 19,215 default notices were filed last quarter, they involved 18,613 homes because some borrowers were in default on multiple loans (e.g. a primary mortgage and a line of credit).
Among the state’s larger counties, loans were least likely to go into default last quarter in Marin, San Francisco and San Mateo counties. The probability was highest in Tulare, Madera and Fresno counties.
The number of Trustees Deeds recorded (TDs), which indicates the actual loss of a home to the formal foreclosure process, totaled 7,799 last quarter. That was the lowest for any quarter since fourth-quarter 2006, when 6,078 homes were foreclosed on. Last quarter’s foreclosures fell 4.9 percent from 8,205 in fourth-quarter 2013 and fell 42.6 percent from first-quarter last year.
The all-time peak was 79,511 foreclosures in third-quarter 2008. The state’s all-time low was 637 in second-quarter 2005, according to DataQuick, whose TD statistics go back to 1988.
On average, homes foreclosed on last quarter took 9.5 months to wind their way through the formal foreclosure process, beginning with an NoD. That’s up from an average of 9.0 months the prior quarter and up from 8.1 months a year earlier.
At formal foreclosure auctions held statewide last quarter, an estimated 39.3 percent of the foreclosed properties were bought by investors or others that don’t appear to be lender or government entities. That was down slightly from an estimated 39.9 percent the previous quarter and down from 47.1 percent a year earlier, DataQuick reported.
Foreclosure resales – properties foreclosed on in the prior 12 months – accounted for 7.7 percent of all California resale activity last quarter. That was up from a revised 6.8 percent the prior quarter and down from 17.1 percent a year ago. Foreclosure resales peaked at 57.8 percent in first-quarter 2009. Among the state’s larger counties last quarter, foreclosure resales varied from 2.1 percent in San Mateo County to 17.5 percent in Madera County.
The role of short sales – transactions where the sale price fell short of what was owed on the property – is also fading. Last quarter short sales made up an estimated 8.7 percent of the state’s resale market, down from an estimated 10.6 percent the prior quarter and 21.0 percent a year earlier.
Notices of Default (Trustees Deeds further down) houses and condos
| County/Region | 2013Q1 | 2014Q1 | Yr/Yr% |
| Los Angeles | 3,984 | 4,191 | 5.2% |
| Orange | 1,282 | 1,244 | -3.0% |
| San Diego | 1,471 | 1,392 | -5.4% |
| Riverside | 1,806 | 1,865 | 3.3% |
| San Bernardino | 1,668 | 1,739 | 4.3% |
| Ventura | 411 | 384 | -6.6% |
| Imperial | 101 | 104 | 3.0% |
| Socal | 10,723 | 10,919 | 1.8% |
| San Francisco | 103 | 117 | 13.6% |
| Alameda | 555 | 607 | 9.4% |
| Contra Costa | 785 | 632 | -19.5% |
| Santa Clara | 441 | 528 | 19.7% |
| San Mateo | 216 | 214 | -0.9% |
| Marin | 87 | 69 | -20.7% |
| Solano | 345 | 363 | 5.2% |
| Sonoma | 194 | 218 | 12.4% |
| Napa | 46 | 32 | -30.4% |
| Bay Area | 2,772 | 2,780 | 0.3% |
| Santa Cruz | 74 | 78 | 5.4% |
| Santa Barbara | 147 | 134 | -8.8% |
| San Luis Obispo | 100 | 85 | -15.0% |
| Monterey | 142 | 142 | 0.0% |
| Coast | 463 | 439 | -5.2% |
| Sacramento | 1,022 | 1,028 | 0.6% |
| San Joaquin | 465 | 468 | 0.6% |
| Placer | 173 | 235 | 35.8% |
| Kern | 503 | 577 | 14.7% |
| Fresno | 551 | 589 | 6.9% |
| Madera | 100 | 100 | 0.0% |
| Merced | 140 | 146 | 4.3% |
| Tulare | 274 | 324 | 18.2% |
| Yolo | 70 | 61 | -12.9% |
| El Dorado | 117 | 116 | -0.9% |
| Stanislaus | 315 | 343 | 8.9% |
| Kings | 73 | 90 | 23.3% |
| San Benito | 26 | 39 | 50.0% |
| Yuba | 55 | 66 | 20.0% |
| Colusa | 10 | 19 | 90.0% |
| Sutter | 57 | 62 | 8.8% |
| Central Valley | 3,951 | 4,263 | 7.9% |
| Mountains | 225 | 252 | 12.0% |
| North Calif | 434 | 562 | 29.5% |
| Statewide* | 18,568 | 19,215 | 3.5% |
includes additional counties
Trustees Deeds Recorded (number of homes foreclosed on) houses and condos
| County/Region | 2013Q1 | 2014Q1 | Yr/Yr% |
| Los Angeles | 2,217 | 1,212 | -45.3% |
| Orange | 572 | 296 | -48.3% |
| San Diego | 882 | 432 | -51.0% |
| Riverside | 1,379 | 801 | -41.9% |
| San Bernardino | 1,363 | 770 | -43.5% |
| Ventura | 255 | 102 | -60.0% |
| Imperial | 89 | 76 | -14.6% |
| Socal | 6,757 | 3,689 | -45.4% |
| San Francisco | 53 | 31 | -41.5% |
| Alameda | 375 | 214 | -42.9% |
| Contra Costa | 528 | 263 | -50.2% |
| Santa Clara | 194 | 107 | -44.8% |
| San Mateo | 92 | 39 | -57.6% |
| Marin | 52 | 21 | -59.6% |
| Solano | 240 | 185 | -22.9% |
| Sonoma | 154 | 71 | -53.9% |
| Napa | 54 | 14 | -74.1% |
| Bay Area | 1,742 | 945 | -45.8% |
| Santa Cruz | 65 | 21 | -67.7% |
| Santa Barbara | 106 | 59 | -44.3% |
| San Luis Obispo | 74 | 37 | -50.0% |
| Monterey | 132 | 61 | -53.8% |
| Coast | 377 | 178 | -52.8% |
| Sacramento | 917 | 591 | -35.6% |
| San Joaquin | 438 | 270 | -38.4% |
| Placer | 215 | 97 | -54.9% |
| Kern | 502 | 304 | -39.4% |
| Fresno | 508 | 359 | -29.3% |
| Madera | 124 | 63 | -49.2% |
| Merced | 169 | 61 | -63.9% |
| Tulare | 221 | 150 | -32.1% |
| Yolo | 76 | 50 | -34.2% |
| El Dorado | 90 | 48 | -46.7% |
| Stanislaus | 371 | 192 | -48.2% |
| Kings | 77 | 55 | -28.6% |
| San Benito | 19 | 16 | -15.8% |
| Yuba | 47 | 53 | 12.8% |
| Colusa | 13 | 12 | -7.7% |
| Sutter | 49 | 41 | -16.3% |
| Central Valley | 3,836 | 2,362 | -38.4% |
| Mountains | 262 | 175 | -33.2% |
| North Calif | 618 | 450 | -27.2% |
| Statewide* | 13,592 | 7,799 | -42.6% |
* includes additional counties
Source: DataQuick; DQNews.com
Media calls: Andrew LePage (916) 456-7157
Copyright 2014 DataQuick. All rights reserved.