
加州硅谷地区2014年12月房屋销售
 《美国洋房网》自DataQuick的报道,加州硅谷地区今年12月房屋销售总量是7456栋,比上个月的6003上升24.2%,比上一年同月的6532栋上升14.1%。12月份的中间房价是$603,000, 比上个月的601,000上升0.3%, 比去年同月的 $548,500上升9.9%。
Bay Area Home Sales and Prices Rise in December 2014
January 15, 2015
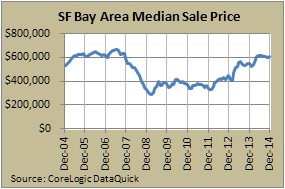
CoreLogic® (NYSE: CLGX), a leading global property information, analytics and data-enabled services provider, today released its December San Francisco Bay Area housing market report. Home buying picked up steam late in 2014, with December posting strong month-over-month and year-over-year sales gains. Price appreciation remained lower than it had been earlier in 2014, but the median sale price, which has moved little since late last summer, was still nearly 10 percent higher than it was the same time a year earlier. A total of 7,456 new and resale houses and condos sold in the nine-county Bay Area in December 2014. That was up month over month 24.2 percent from 6,003 in November 2014 and up year over year 14.1 percent from 6,532 in December 2013, according to CoreLogic DataQuick data. A rise in sales from November to December is normal for the season. Bay Area sales have risen an average of 9.6 percent between those two months since 1988, when CoreLogic DataQuick data began. The region’s monthly home sales have ranged between 7,000 and 8,000 for seven of the last nine months. Since 1988, December sales have varied from a low of 5,065 in 2007 to a high of 12,349 in 2003, and the December 2014 sales were 12.1 percent below the December average of 8,482. The median price paid for a home in the Bay Area was $603,000 in December 2014. That was up month over month by 0.3 percent from $601,000 in November 2014 and up year over year 9.9 percent from $548,500 in December 2013. December 2014 was the 33rd consecutive month with a year-over-year gain in the median sale price. However, those annual increases slipped from double-digit to single-digit in the last two months of 2014. In December 2013 the region’s $548,500 median was 23.9 percent higher than in December 2012. The Bay Area median sale price peaked at $665,000 in June and July 2007 and dropped to a post-boom low of $290,000 in March 2009. “The Bay Area’s residential real estate market ended 2014 on a cautiously optimistic note, with moderate year-over-year increases in both median price and sales counts,” said John Karevoll, CoreLogic DataQuick analyst. “Supply continues to be constrained, and the mortgage market remains difficult. As long-term trends, cash sales and investor purchases are declining slowly, but they are still significant market factors. We know that there is a significant amount of pent-up demand lying in wait, and there is a good chance the market could see a surge this spring and summer as more homes are put up for sale.” Other December 2014 Bay Area housing market highlights include the following:
- Adjustable-rate mortgages (ARMs), an important indicator of mortgage availability, accounted for 22.3 percent of the Bay Area’s home purchase loans in December 2014, down from a revised 23.6 percent in November 2014, and up from 22.2 percent in December 2013. ARMs hit a low of 3.0 percent of purchase loans in January 2009 and reached a post-housing-bust peak of 27.8 percent in April 2014. Since 2000, ARMs have accounted for 46.2 percent of all Bay Area purchase loans.
- Jumbo loans, or mortgages above the old conforming limit of $417,000, accounted for 54.1 percent of purchase lending in December 2014, down from a revised 56.4 percent in November 2014, and up from 48.2 percent in December 2013. Jumbo usage dropped to as low as 17.1 percent in January 2009. It reached 56.4 percent in May 2014 and has stayed close to that percentage since. Prior to the August 2007 credit crunch, jumbo loans accounted for more than 60 percent of the Bay Area’s home purchase loans.
- Foreclosure resales accounted for 3.7 percent of all resales in December 2014, up from 2.8 percent in November 2014, and down from 4.6 percent in December 2013. Foreclosure resales in the Bay Area peaked at 52.0 percent in February 2009, while the monthly average over the past 17 years is 9.6 percent. Foreclosure resales are purchased homes that have been previously foreclosed upon in the prior 12 months.
- Short sales made up an estimated 4.0 percent of Bay Area resales in December 2014, up from a revised 3.9 percent in November 2014 and down from 7.9 percent in December 2013. Short sales are transactions in which the sale price fell short of what was owed on the property.
- Absentee buyers – mostly investors – purchased 18.3 percent of all Bay Area homes in December 2014, up insignificantly from a revised 18.2 percent in November 2014 and down from 22.5 percent in December 2013. The November 2014 absentee level was the lowest for any month since August 2010, when it was 17.8 percent. The peak absentee share was 28.7 percent in February 2013, and the monthly average since 2000, when CoreLogic DataQuick absentee data began, is 15.7 percent.
- Cash buyers accounted for 19.0 percent of home sales in December 2014 – the lowest for any month since the cash buyer level was 18.5 percent in October 2008. The December 2014 absentee level was down slightly from a revised 19.3 percent in November 2014 and down from 23.5 percent in December 2013. The peak was 32.3 percent in February 2013, and the monthly average since 1988 is 13.7 percent.
- Bay Area home buyers used $2.18 billion of their own money in the form of a down payment or as an outright cash purchase in December 2014. They borrowed $3.06 billion in mortgage money from lenders.
- The typical monthly mortgage payment for Bay Area home buyers in December 2014 was $2,264. Adjusted for inflation, that payment was 21.6 percent below the typical payment in spring 1989, the peak of the prior real estate cycle. It was 42.0 percent below the current cycle’s peak in July 2007 and 77.1 percent above the February 2012 bottom of the current cycle.
- Total December Home Sales in the San Francisco Bay Area counties
Homes Sold Median Sale Prices All homes Dec-13 Dec-14 Percent Change Dec-13 Dec-14 Percent Change Alameda 1,410 1,545 9.60% $525,000 $555,000 5.70% Contra Costa 1,177 1,447 22.90% $405,000 $455,000 12.30% Marin 220 276 25.50% $755,000 $915,000 21.20% Napa 111 122 9.90% $425,000 $450,000 5.90% Santa Clara 1,578 1,774 12.40% $625,000 $689,500 10.30% San Francisco 529 529 0.00% $813,000 $949,000 16.70% San Mateo 565 666 17.90% $750,000 $808,000 7.70% Solano 477 535 12.20% $272,000 $310,000 14.00% Sonoma 465 562 20.90% $415,000 $454,500 9.50% Bay Area 6,532 7,456 14.10% $548,500 $603,000 9.90% Source: CoreLogic DataQuick. Data available at DQNews.com © 2015 CoreLogic, Inc. All rights reserved.