
全加州2014年9月房屋销售情况
 《美国洋房网》自DataQuick的报道,全加州今年9月房屋销售总量是36,316栋,比上个月的37,228下降2.4%,比上一年同月的36,027栋上升0.8%。9月份的中间房价是$389000, 比上个月的393000下降1.0%, 比去年同月的 $355,000上升9.6%。
California September Home Sales
October 14, 2014
An estimated 36,316 new and resale houses and condos sold statewide in September. That was down 2.4 percent from 37,228 in August, and up 0.8 percent from 36,027 sales in September 2013, according to CoreLogic DataQuick data.
Last month’s slight year-over-year sales increase was the first in a year, and sales were the highest for the month of September in five years. September sales have varied from a low of 24,460 in 2007 to a high of 69,304 in 2003. Last month’s sales were 15.5 percent below the average of 42,996 sales for all the months of September since 1988, when Irvine-based CoreLogic DataQuick’s statistics begin. California sales haven’t been above average for any particular month in more than eight years.
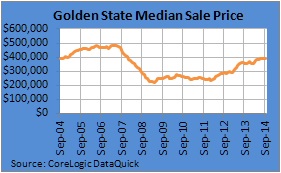
The median price paid for a home in California last month was $389,000, down 1.0 percent from $393,000 in August and up 9.6 percent from $355,000 in September 2013. Last month was the 31st consecutive month in which the state’s median sale price rose year-over-year. In March/April/May 2007 the median peaked at $484,000. The post-peak trough was $221,000 in April 2009.
Of the existing homes sold last month, 5.3 percent were properties that had been foreclosed on during the past year. That was down from a revised 5.4 percent in August and down from 7.1 percent a year earlier. Foreclosure resales peaked at 58.8 percent in February 2009.
Short sales – transactions where the sale price fell short of what was owed on the property – made up an estimated 5.9 percent of the homes that resold last month. That was the same as in August and down from 10.8 percent a year earlier.
The typical monthly mortgage payment that California buyers committed themselves to paying last month was $1,507, down from $1,523 the month before and up from $1,437 a year earlier. Adjusted for inflation, last month’s payment was 36.0 percent below the typical payment in spring 1989, the peak of the prior real estate cycle. It was 48.1 percent below the current cycle’s peak in June 2006. It was 60.5 percent above the January 2012 bottom of the current cycle.
Indicators of market distress continue to decline. Foreclosure activity remains well below year-ago and peak levels reached in the last five years. Financing with multiple mortgages is low, while down payment sizes are stable, CoreLogic DataQuick reported.
Source: CoreLogic DataQuick; DQNews.com
Copyright DataQuick. All rights reserved.