
全加州2014年7月房屋销售情况
 《美国洋房网》自DataQuick的报道,全加州今年7月房屋销售总量是39,596栋,比上个月的37,734上升4.0%,比上一年同月的45,937栋下降14.0%。7月份的中间房价是$392,000, 比上个月的$393,000下降0.3%, 比去年同月的 $363,000上升8.0%。
An estimated 39,608 new and resale houses and condos sold statewide in July. That was up 0.9 percent from 39,254 in June, and down 8.7 percent from 43,381 sales in July 2013, according to Irvine-based CoreLogic DataQuick.
July sales have varied from a low of 30,596 in 1995 to a high of 71,186 in 2004. Last month’s sales were 14.0 percent below the average of 45,935 sales for all months of July since 1988, when CoreLogic DataQuick statistics begin. California sales haven’t been above average for any particular month in more than eight years.
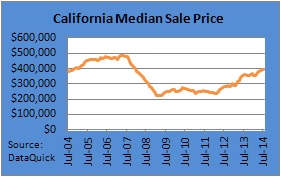
The median price paid for a home in California last month was $392,000, down 0.3 percent from $393,000 in June and up 8.0 percent from $363,000 in July 2013. Last month was the 29th consecutive month in which the state’s median sale price rose year-over-year. It was the first year-over-year increase below 10 percent since June 2012, when the $274,000 median was up 8.3 percent. This cycle’s year-over-year increases peaked at 29.2 percent in July last year.
In March/April/May 2007 California’s median sale price hit an all-time peak of $484,000. The post-peak trough was $221,000 in April 2009.
Of the homes that resold last month, 5.6 percent were properties that had been foreclosed on during the past year. That was down from 5.8 percent in June and down from 8.3 percent a year earlier. Foreclosure resales peaked at 58.8 percent of the resale market in February 2009.
Short sales – transactions where the sale price fell short of what was owed on the property – made up an estimated 6.6 percent of the homes that resold last month. That was up slightly from an estimated 6.3 percent the month before and down from 12.7 percent a year earlier.
The typical monthly mortgage payment that California buyers committed themselves to paying last month was $1,521, down from $1,530 the month before and up from $1,449 a year earlier. Adjusted for inflation, last month’s payment was 35.6 percent below the typical payment in spring 1989, the peak of the prior real estate cycle. It was 47.8 percent below the current cycle’s peak in June 2006. It was 61.6 percent above the January 2012 bottom of the current cycle.
Source: DataQuick; DQNews.com
Copyright DataQuick. All rights reserved.